Geographic Heat Map
Wednesday, July 31, 2019
Video on How to use the Heat Map add-in
Wednesday, July 24, 2019
Bug in Office 365 builds of Excel
A bug with Excel may affect some users when they save and reopen the files with the add-in on Windows.
For these users, closing and reopening the file may cause any settings (color themes, map type, title) to be lost.
The specific affected versions of Excel on Windows [Excel Online and Excel Mac are not affected by this change] are:
- "April update" [16.0.11629.20246]
- "May update" [16.0.11727.20244]
Microsoft is aware of the issue and has a fix planned: https://github.com/OfficeDev/office-js/issues/626.
Heatmap July 2019 Update
Greetings,
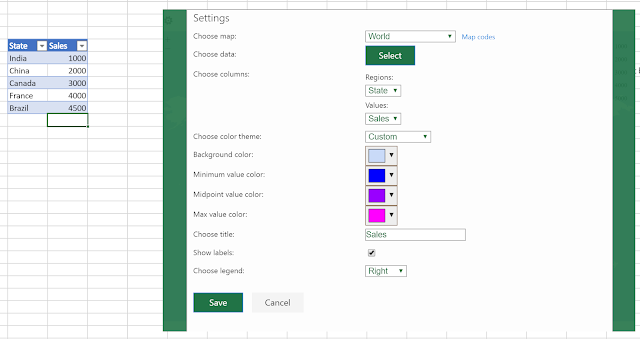
The Geographic Heat Map add-in has been updated with the following new features:
- Ability to set data labels
- Ability to set a data legend
- Ability to customize the color themes with a Custom Theme
Hope you enjoy!
If you have questions or would like to see more, send feedback to geographicheatmapaddin@outlook.com
Monday, November 26, 2012
Unemployment Dashboard
Here's an unemployment dashboard from June 2012, using both the heat map. You can use slicers to the left to modify and filter your data. I promise to have a walkthrough on this soon, but for now try it out!
Subscribe to:
Comments (Atom)

